Husky Data
by Silence Dogood
The Analytics and Institutional Data Research Team just released their first HuskyData newsletter. The focus of the HuskyData newsletter is “a regular newsletter dedicated to sharing data and information about SCSU and our students.” Sharing data is clearly important if the goal is transparency.
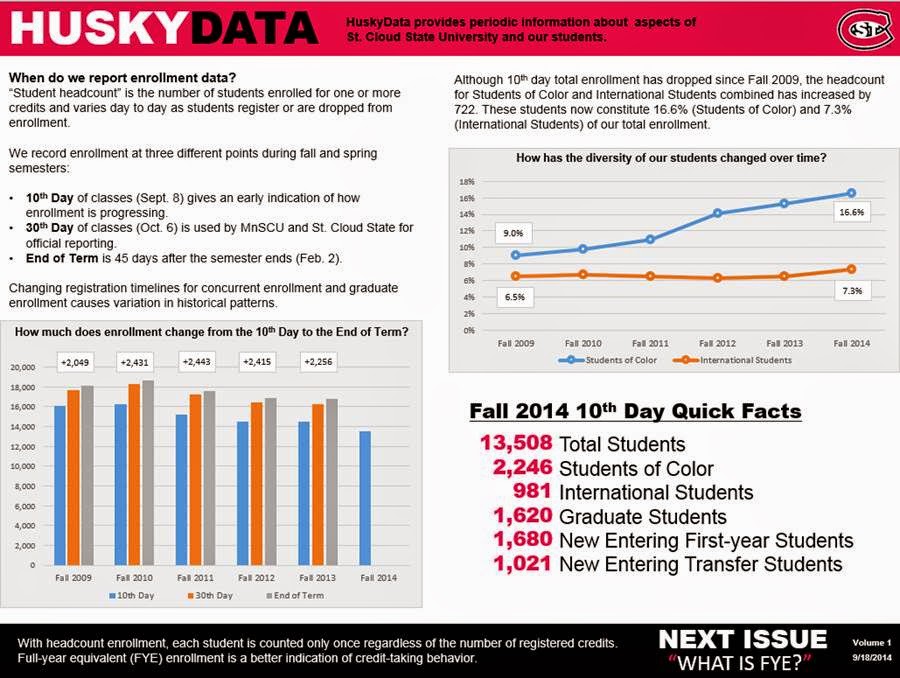
The first issue of HuskyData lists some of the reporting of data by the university and MnSCU. The thrust of the first graphic focused on headcount. It shows that the headcount enrollment increases from the 10th day to the 30th day to the final enrollment. While this is certainly true, it completely misses the important point that whether you look at the 10th day, the 30th day, or the final enrollment, the numbers are declining significantly! Even looking at the final headcounts for Fall 2010 and Fall 2013, it looks like a drop of 2,000 in headcount.
A second major point is that the numbers for the 30th day headcount enrollment and final headcount enrollments increase as a result of the reporting of the enrollments in the Senior-to-Sophomore program (S2S). If you look at enrollments at Winona, which does not participate in the S2S their 10th day, 30th day and final enrollments are very nearly the same.
A third major point is that the explosive growth in headcount enrollment due to the PSEO program, which includes the traditional on campus PSEO and concurrent enrollment high school courses, masks the decline in the headcount enrollment of ‘regular’ students. The figure below shows the New Entering Freshmen (NEF) and New Entering Transfer (NET), the PSEO enrollment, and the sum of the two.
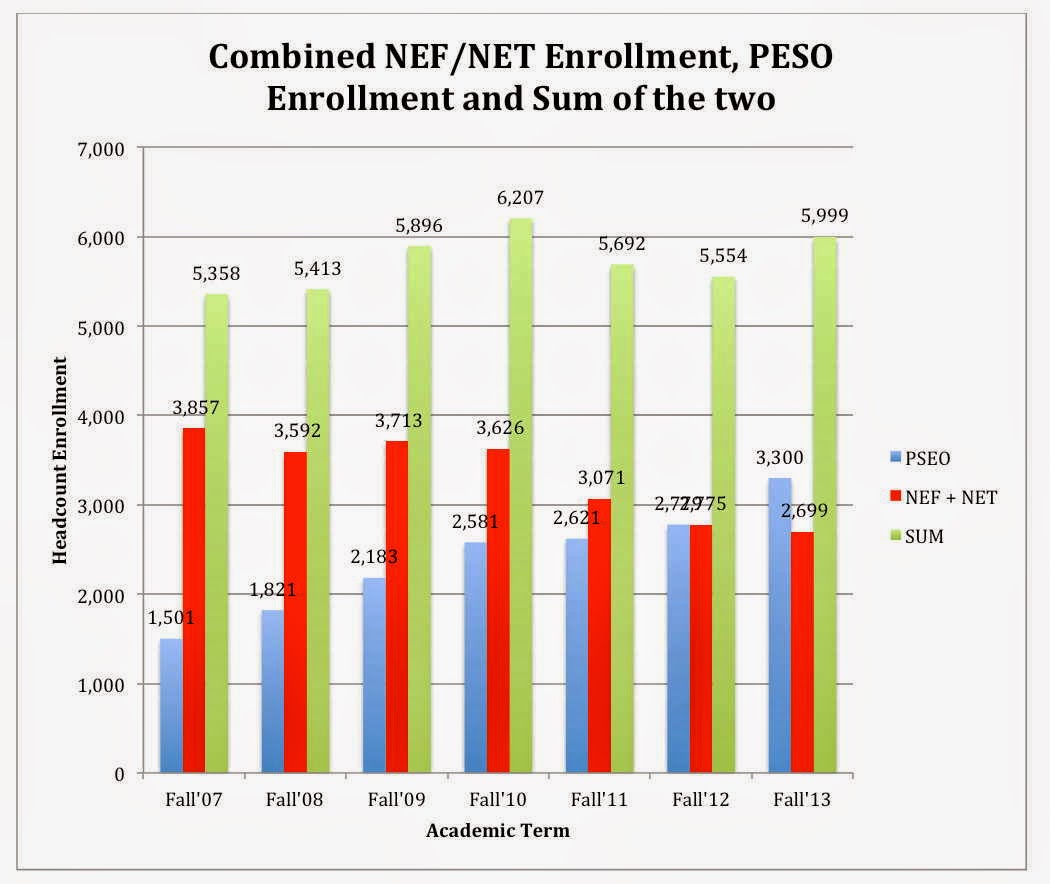
Looking at this figure, it is clear that the overall headcount enrollment is increasing or at least from Fall’10 to Fall’13 is down only very slightly.
The most egregious issue of this plot is that if you look at the final enrollments for FY12 and FY13, it looks like they are very nearly the same. The plot is small and there are no data labels listing the values (even if there were you would not be able to see them). However, even if the headcount for FY12 and FY13 was nearly the same, the actual FYE enrollment fell 284 students. An estimate calculated using information reported by Bruce Busby at the most recent Budget Advisory Group meeting is that each FYE lost represents a loss of $11,258 in tuition. As a result, a loss of 284 FYE therefore represents a decline in revenue of $3,197,400. HuskyData is a clear example of why headcounts don’t mean much except for bragging rights for university presidents.
So much for transparency!
Technorati: Earl Potter, St. Cloud State, Declining Enrollment, Silence Dogood
